ECHE statistics
María Kristín Gylfadóttir, Rannís
Eyrún Sigurðardóttir, Rannís
Introduction
ECHE applications require applicants to provide basic statistical information about their institution and their international cooperation activities (mobility and agreements). The questions are divided into four different categories: overview of the institution (number of staff, students and degree courses on offer), student mobility, staff mobility and international cooperation. When reading this chapter, it needs to kept in mind that statistics on staff mobility only include Erasmus funded mobility while statistics on student mobility also include all other mobility programmes available for students. In regards to student mobility, traineeship (work placements) and study mobility are reported separately. Similarly, data for the staff and student mobility categories refer to the academic year 2011-2012 whereas the overview and cooperation categories refer to the academic year 2012-2013, and are thus not fully comparable.
The ECHE applications analysed in the chapter come from 180 higher education institutions in the Nordic countries - Denmark, Finland, Iceland, Norway and Sweden. In the case of Denmark one institution was not included as no data was reported for the institution in question. In one case of an Icelandic institution part of the data reported was corrected, as the reported numbers were very different from previously reported data. In this case the previously reported data was used instead of the data provided in the ECHE application. Leaving the data unchanged would have significantly distorted the results for Iceland which had only 7 applications.
Data overview
Table 1 below shows a general overview of some of the data provided by the 180 institutions in their ECHE applications. The table shows totals for each category in each of the five countries.
There are four different categories of data provided in the applications. It should be noted that comparability of data is not optimal for several reasons. Firstly, student mobility data refers to all student mobility opportunities, Erasmus and others, for students while the staff mobility data refers only to Erasmus staff mobility. Similarly, the staff and student mobility categories refer to the academic year 2011-2012 whereas the overview and cooperation categories refer to the academic year 2012-2013.
In the 180 Nordic higher education institutions which had just over 1,2 million students in 2012-2013, 36.799 were mobile during the previous academic year under various mobility programmes. Incoming students were slightly more in numbers or 41.132. Staff mobile under Erasmus in 2011-2012 were 4.196 out of 172.337 employed by the institutions. Incoming staff was slightly lower than outgoing or 3.838.
| Country | No. of HEIs |
Total no
of stud. (2012-2013) |
Total incoming students (2011-2012) | Total outgoing students (study+WP) (2011-2012) | Total staff (2012-2013) | Total incoming staff (Erasmus participating countries) (2011-2012) | Total outgoing staff (Erasmus participating countries) (2011-2012 |
| Denmark | 39 | 274.750 | 8.484 | 9.603 | 41.463 | 570 | 539 |
| Finland | 40 | 298.257 | 9.454 | 10.439 | 42.378 | 1.932 | 2.269 |
| Iceland | 7 | 20.691 | 681 | 444 | 2.471 | 133 | 93 |
| Norway | 52 | 198.087 | 6.371 | 6.480 | 30.327 | 496 | 596 |
| Sweden | 42 | 438.792 | 16.142 | 9.833 | 55.698 | 707 | 699 |
| Grand Total | 180 | 1.230.577 | 41.132 | 36.799 | 172.337 | 3.838 | 4.196 |
Table 1. Overview of numbers by country
Student mobility
Proportion of mobile students of all students in Nordic countries
Data on student mobility in ECHE applications include credit mobility, both study mobility and traineeships, international degree students (incoming), and where applicable, number of local and international students enrolled in double/multiple/joint degrees for the academic year 2011-2012. The data includes outbound and inbound flows of students in all the different categories above as well as within different funding programmes.
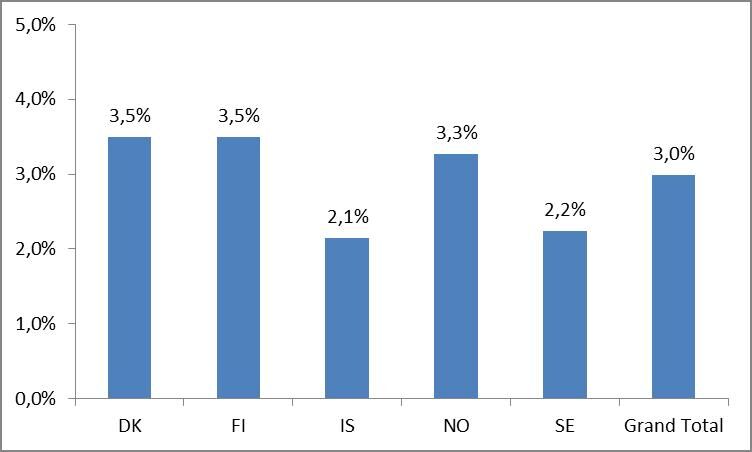
Graph 1. Proportion of all outgoing student credit mobility (study and traineeship) of all students by country.
When looking at the proportion of students who went on mobility out of all students enrolled in higher education in each country in the academic year 2011-2012 (see graph 1) we can see that 3,5% of all higher education students in Denmark and Finland went on mobility in the reference year, Norway has a slightly lower proportion 3,3%, but Iceland and Sweden had only 2,1% and 2,2% outgoing student mobility in the reference year. The reason for the different levels of mobility activity in the case of Iceland is most likely fewer mobility opportunities than in the other Nordic countries. In the case of Sweden the lower rates are most likely linked to the “free movers” of students who go abroad outside the exchange programmes offered by the HE institutions.
Balance of outgoing versus incoming student mobility
When comparing statistics for outgoing and incoming student mobility only study mobility is included because for traineeships only data on outgoing mobility is reported in the ECHE applications and not incoming. Graph 2 shows the difference between outgoing and incoming student mobility of all incoming and outgoing study mobility.
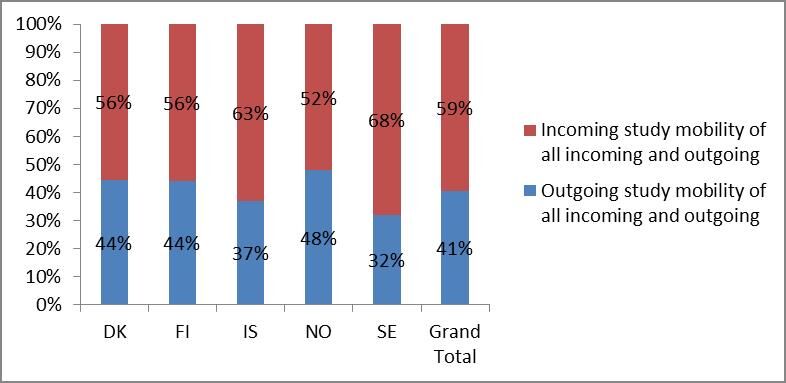
Graph 2. Proportion of outgoing mobility and incoming mobility of all study mobility.
As the graph above shows, all the Nordic countries have a higher proportion of incoming mobility than outgoing, meaning that all countries receive more students on study mobility than they send out. In the academic year 2011-2012, as noted in Table 1 above, outgoing students from the 180 institutions analysed where 36.799 while incoming students were 41.132, or 11,8% more than outgoing. Iceland and Sweden had the lowest proportion of outgoing students in comparison with incoming, only 37% and 32% respectively, which means that they received almost twice as many students as they sent out. If graphs 1 and 2 are reviewed together, one can see that there is less balance between incoming and outgoing mobility in Iceland and Sweden, not because more students come in, but because fewer students go out. If free mover [1] however, are included for Sweden, the amount of incoming and outgoing students is nearly balanced.
Several factors contribute to the imbalance between incoming and outgoing mobility students in the Nordic countries. Nordic university student cohorts are in general older than university students in other European countries and more students have families, making student mobility less accessible, particularly in programmes where minimum duration is up to 3 months. Many students in the Nordic countries are also in “reality” only studying part time although registered as full time students. Data on time to completion of a university degree shows this clearly. All these factors and more have contributed to lower outgoing short-term mobility by Nordic students. In regards to the high numbers of incoming students, the Nordic countries have traditionally been a popular destination for students from other countries, in particular as many institutions offer courses in English.
Study mobility to Erasmus programme countries versus non-participating countries
Students could in the academic year 2011-2012 either go on credit mobility to countries participating in the Erasmus programme or to non-participating countries. Graph 3 below shows the proportion of students who went on study mobility to Erasmus participating countries on the one hand, and on the other hand to non-participating countries.
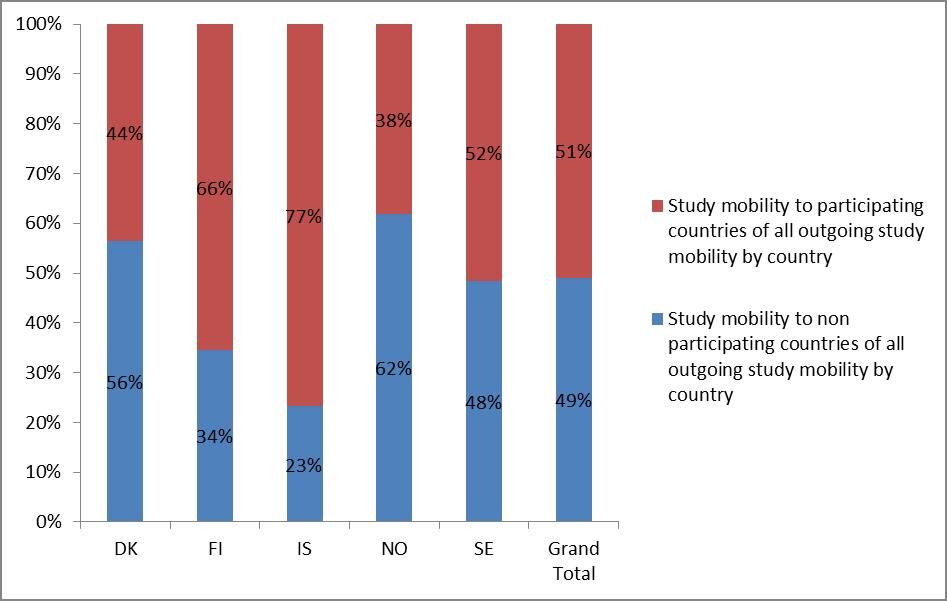 Graph 3. Proportion of credit study mobility to Erasmus participating countries and non-participating countries of all outgoing study mobility by country.
As graph 3 above shows, the proportion of mobility activity to participating and non-participating Erasmus programme countries is very different between the Nordic countries. Iceland has the smallest proportion of mobility to non-participating countries or 23%, while Norway has the highest, or 62%. Study mobility to non-participating countries is also over 50% in Denmark and most balanced in Sweden whereas in Finland and Iceland student mobility to participating countries is considerably higher than to non-participating countries, 66% and 77% respectively.
A possible explanation for the difference between the Nordic countries when it comes to mobility to participating or non-participating Erasmus countries is different ways and levels of funding. In Norway the state loan fund gives students the financial opportunity to go on exchange anywhere they want, bringing their grant/loan. In Norway about two out of three students go outside of Europe the two most popular destinations being the United States and Australia, whereas four out of five incoming students are from Europe. Denmark has a similar system of portability of grants/loans but in addition students get a grant to cover tuition fee abroad up to a fixed maximum amount (udlandsstipendium). In Iceland and Finland students can also take their study grant/loans abroad but in the case of Iceland there are not student grants, only loans, which makes it more expensive for Icelandic students to study abroad than at home and thus makes students more dependent on Erasmus grants.
Outbound student mobility for traineeships (placements)
As can be seen in graph 4 below, outgoing traineeship mobility (placements) is much less common than study mobility. There are several plausible explanations for this. The most important one is that traineeships have only been offered within the Erasmus programme since 2007 while study mobility has been supported since 1987. While the traineeship action has been very popular and traineeship mobilities have systematically increased every year, there are still more barriers within study programmes at higher education institutions to go on a traineeship abroad than on a study period. In some cases higher education institutions do not find traineeships of the same academic value as study period thus making them more reluctant to utilize this option.
While the proportion of traineeships of all outbound student mobility for all the Nordic countries is 24% the proportion varies greatly when looking at each country. While Denmark, Finland and Sweden have a somewhat similar proportion of traineeship mobility or 23-29%, Iceland and Norway stand out with a much smaller proportion of traineeship mobility, standing at only 10% respectively of all outgoing mobility in the academic year 2011-2012. Norway and Iceland have a weak tradition when it comes to traineeships in higher education, not only when it comes to international mobility, but also on a national level.
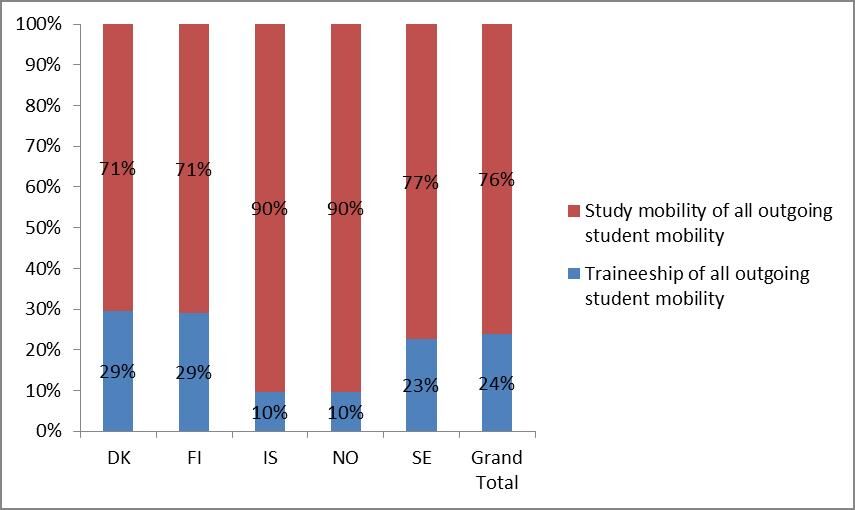
Graph 4. Percentage of traineeships of all outgoing credit student mobility by country.
Within the Erasmus programme, students can only go on traineeship mobility to participating countries. The data presented in Graph 5 below, thus only reflects traineeship mobility activity under non-Erasmus programmes. As graph 5 below indicates, a greater proportion of outgoing traineeship students from Norway and Sweden go to non-participating countries than Danish and Finnish students who in just under half the time go to non-participating countries. Only one of the Icelandic higher education institutions reported traineeship mobility to non-participating countries.
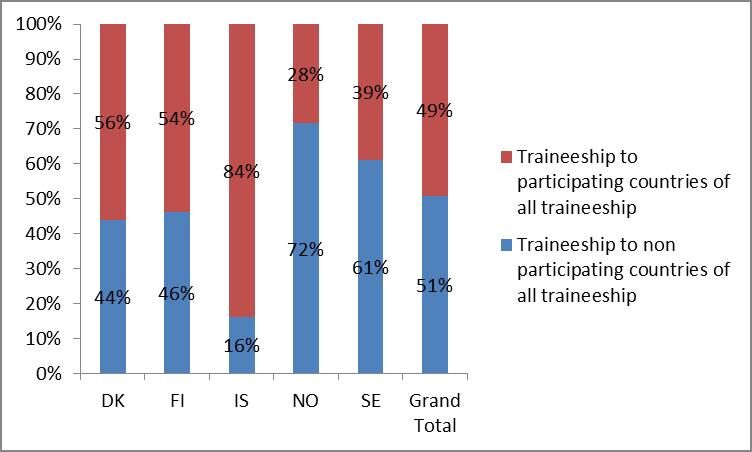 Graph 5. Percentage of traineeship to Erasmus participating and non-participating countries of all traineeships by country.
Mobile students enrolled in double/joint degree programmes
A few Nordic higher education institutions offer double/joint degrees for both local and international students. (Further discussion of inter-institutional agreements can be found under the section “agreements and joint degrees”). Graph 6 shows the proportion of international students enrolled in international double/joint degrees versus the total number of local double/joint degree students. In all the Nordic countries the proportion of international students is much higher than the proportion of local students in double/joint degrees.
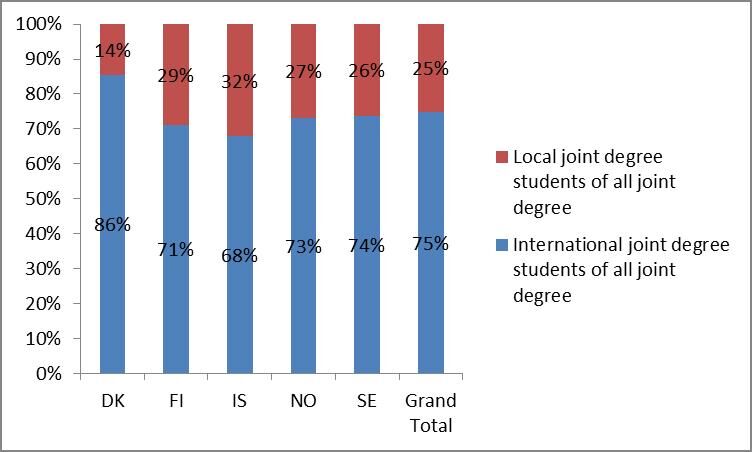
Graph 6. Percentage of international and local double/multiple/joint degree students.
Out of the Nordic countries, Denmark stands out with 86% of all double/joint degree students being international. The other countries have quite similar proportions of international students enrolled double/joint degrees, or between 68% and 75%, and Iceland is the only country that goes below 70% of international students enrolled in double/joint degree at Icelandic higher education institutions.
Staff mobility
Like students, higher education staff has the option of going on mobility to other countries, both for training and on teaching assignments. As stated above, the data on staff mobility in the ECHE applications only include Erasmus staff mobility so the picture presented here is only a partial view of the overall mobility flows of higher education staff for teaching and training (research is excluded).
Proportion of mobile staff out of total number of staff at Nordic higher education institutions
Data provided in Graph 7 below shows the percentage of staff that went on Erasmus mobility from each of the Nordic countries as a proportion of total higher education staff in each of the countries in the academic year 2011-2012.
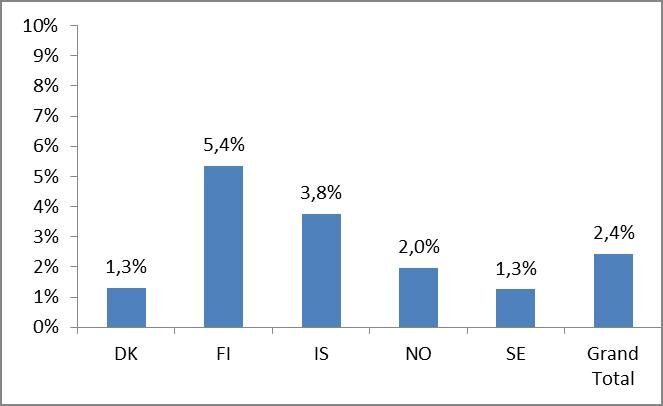
Graph 7. Percentage of outgoing staff of all staff by country.
As graph 7 shows, Finland has the highest percentage of outgoing staff mobility with 5,4% of all higher education staff going on mobility in the academic year 2011-2012 while higher education staff in Denmark and Sweden were the least mobile with only 1,3% of staff being mobile in the reference academic year. Iceland and Norway come in between with 3,8% and 2% mobile staff respectively. When it comes to Norway it is possible that staff, like students, is more prone to going on mobility outside Europe and that Norwegian economic frames are comparatively good, making staff less dependent on Erasmus mobility funds. The reason for the low staff mobility in Denmark might be similar to Norway, staff may find Erasmus to be too much of an administrative burden so if they are not dependent on Erasmus funds they might not apply. Why Finland stands out with such a high proportion of staff being mobile under Erasmus is difficult to say. In general there is pressure on a national level in Finland to be active in both student and staff mobility. Finnish higher education institutions, further give lower Erasmus grants to staff than in the other Nordic countries and top them up with own funds in order to give more staff the possibility to be mobile. In Iceland, no such top-up options are available and national sources, other than institutional funds, for mobility are also scarce. Even though these percentages are similar to those of outgoing student mobility proportion to all students it is good to keep in mind that staff mobility flows within the Erasmus programme, reflects to a much greater extent the availability of funds than the real mobility demand of the staff as only 10% of Erasmus funds could traditionally be used towards staff mobility.
Balance of outgoing and incoming staff mobility flows
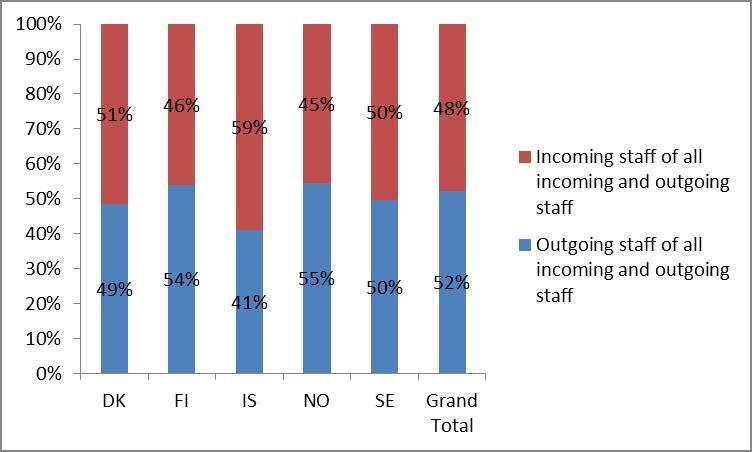
The data reveals a better balance between outgoing and incoming staff mobility flows than student mobility flows. Graph 8 below shows the balance between outgoing and incoming staff mobility. There is good balance between outbound and inbound staff mobility flows in all the Nordic countries with the greatest difference in Iceland, where 59% in 2011-2012 were incoming and 41% outgoing.
Agreements and joint degrees
All higher education institutions can enter into cooperation agreements with other institutions. In the ECHE applications three types of agreements are included: Erasmus agreements, other (non-Erasmus) agreements with participating countries, and agreements with non-participating countries. Graph 9 shows the proportion of each type of agreement in each country.
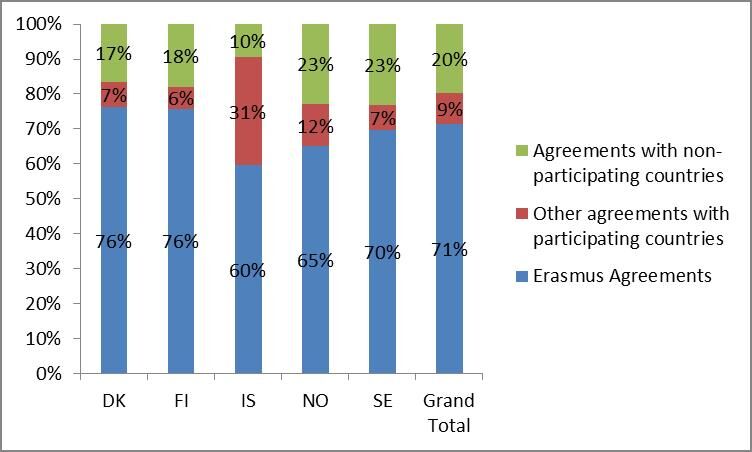
Graph 9. Proportion of different types of agreements in each country.
Erasmus agreements are the dominating type of agreements for all the Nordic countries ranging from 60% in Iceland to 76% in Denmark and Finland of all agreements in each country. The average number of agreements for each higher education institution is very different between the Nordic countries. For Erasmus agreements it ranges from 91 Erasmus agreements on average per higher education institution in Norway to 223 in Finland. When it comes to other agreements with participating countries, Icelandic higher education institutions stand out as 31% of agreements fall into this category (73 agreements on average per higher education institution). The other Nordic countries are more similar in regards to the proportion of other agreements with participating countries which range from 6% in Finland to 12% in Norway. Higher education institutions in Norway and Sweden have the biggest proportion of agreements with non-participating countries, 23% each, whereas in Iceland this type of agreements is only 10% of the total number of inter-institutional agreements. Table 2, below shows the average number of each type agreements per higher education institution in each country as well as the total number of agreements.
| Average number of agreements per HEI | Total number of agreements per country | ||||||
| Country | Erasmus agreements | Other agreements with participating countries | Agreements with non-participating countries | Erasmus agreements | Other agreements with participating countries | Agreements with non-participating countries | Total |
| DK | 156 | 15 | 34 | 6.078 | 576 | 1.319 | 7.973 |
| FI | 223 | 18 | 53 | 8.912 | 719 | 2.128 | 11.759 |
| IS | 141 | 73 | 23 | 986 | 512 | 158 | 1.656 |
| NO | 91 | 17 | 32 | 4.750 | 884 | 1.676 | 7.310 |
| SE | 193 | 20 | 64 | 8.107 | 836 | 2.705 | 11.648 |
| Grand Total | 160 | 20 | 44 | 28.833 | 3.527 | 7.986 | 7.986 |
Table 2. Average number of agreements per HEI and total number of agreements per country
When it comes to cooperation agreements between higher education institutions, it is likely that there are multiple Erasmus agreements between institutions while there is usually only one agreement with each institution from a non-participating country, the reason for this is most likely convenience. Agreements might also be open and exist on paper despite not really being in use.
Higher education institutions can also enter into consortium agreements for double/multiple/joint degrees. Cases are found in all the Nordic countries of such agreements. In graph 10 below we see the proportion of higher education institutions in each of the Nordic countries that have double/multiple/joint degree agreements out of the total number of higher education institutions in each country.
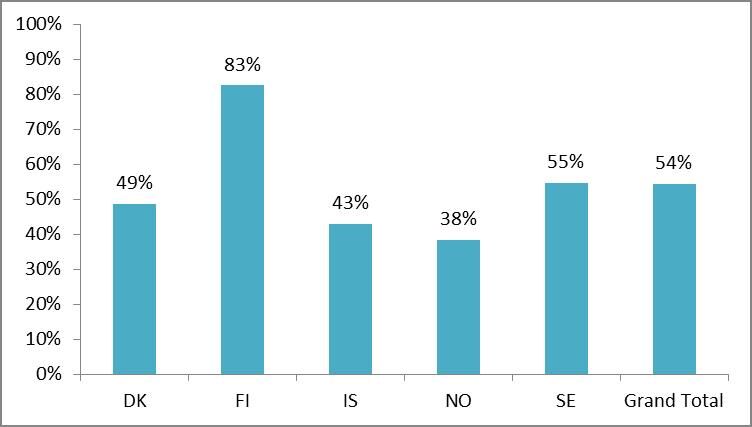
Graph 10. Proportion of Nordic higher education institutions offering double/multiple/joint degree out of all ECHE universities in each country.
The highest proportion of higher education institutions offering double/multiple/joint degrees is in Finland where 83% of institutions have such agreements. The proportion is, however, between 38 and 55% in the other four Nordic countries. Each higher education institution can offer as many double/multiple/joint degree agreements as they want. The data shows that Danish higher education institutions have between 1 and 25 such agreements each. In Finland, higher education institutions have between 1 and 35 and Sweden has between 1 and 40. In Iceland, institutions have between 2-21 agreements and Norway has the smallest range, 1-15 double/multiple/joint agreements per higher education institution.
Number of students per international office staff
International cooperation at higher education level often requires separate offices, or at least staff within each institution, dedicated to working on facilitating international cooperation and managing student and staff mobility, as well as inter-institutional agreements. In the ECHE application the applicant was requested to indicate how many “equivalent full-time administrative staff engaged in the institution´s European and International Offices, were working for the Erasmus programme in the academic year 2012-2013.” Institutions were asked to indicate on one hand the number of staff dedicated to these tasks at central level and on the other, the number of staff at faculty/school/department level.
A review of the data provided in the Nordic applications indicates that this question might possibly have been misunderstood by some institutions, or at least interpreted in different ways. For example “full time equivalent” is very likely to have been confused with counting number of people involved in this work (number of heads). This fact should be kept in mind when looking at graph 11 below which shows how many students are enrolled at the higher education institutions in each country for each full-time equivalent administrative staff member working for the degree programmes on offer at the institution. Here both centralised and decentralised staff are included as well as the total number of students in each country, not just students participating in mobility.
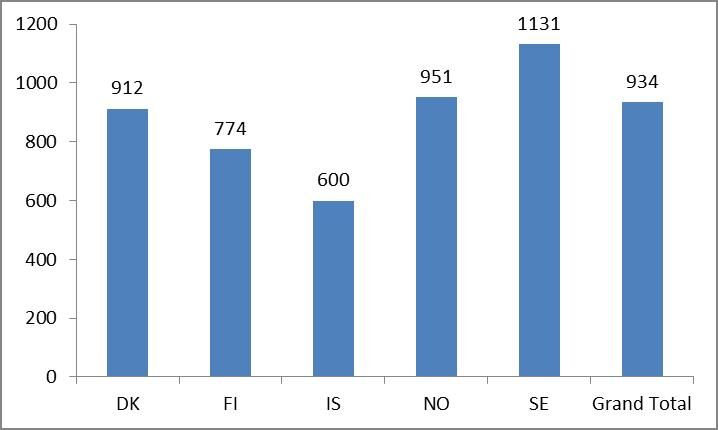 Graph 11. Number of students per full-time equivalent administrative staff member working for the Erasmus programme.
Out of the five Nordic countries, Iceland has the fewest students per each full-time equivalent administrative staff member working for the Erasmus programme, or 600 students. Sweden has almost double that or 1131 students for each full-time equivalent staff. The other countries fall somewhere in between these two.
Summary
In summary, the statistical data presented in the 180 Nordic ECHE applications, gives an overview of the international cooperation activities of these higher education institutions. While all the data is not fully comparable as different categories refer to different academic years, it provides a valuable comparable insight into these activities.
In regards to all outgoing student mobility in higher education in the academic year 2011-2012, 3,3-3,5% of students in Denmark, Finland and Norway where mobile, while only 2,1 and 2,2% of students in Iceland and Sweden respectively were mobile that year. This pattern is similar when the balance between incoming and outgoing study mobility is examined. Here Sweden and Iceland have a smaller proportion of outgoing mobility in comparison with incoming than the other Nordic countries. All the Nordic countries have, however, in common that inbound student mobility flows are higher than outbound with inbound mobility ranging from 52% in Norway to 68% in Sweden. Outgoing mobility can be either to country participating in the Erasmus programme (only Europe) or to a non-participating country. Two Nordic countries, Denmark and Norway, have more outgoing study mobility to non-participating countries than to participating countries, 56% and 62% respectively. Sweden has the most balanced flow with 48% study mobility to non-participating countries whereas Finland has 34% outgoing mobility to non-participating countries and Iceland only 23%.
Traineeship student mobility is a much less developed action than study mobility. In all the Nordic countries, traineeships are only a small proportion of outgoing short-term credit mobility. In all the countries less than one third of the students who went abroad went on traineeship mobility. Iceland and Norway stand out with about one tenth of all mobility being traineeship mobility. Within the Erasmus programme traineeship mobility is only possible within Europe but there are other funding possibilities for traineeship in non-participating countries. Like in study mobility, Norwegian students go in higher numbers on traineeships to non-participating countries. 72% of Norwegian students do traineeships in non-participating countries while the rate for Swedish students is 61%. A little less than half of Danish and Finnish students who did traineeships went to non-participating countries, or 44 and 46% respectively. Icelandic students on the other hand don´t seem to have much opportunity to go on placements outside Europe with only 16% of students going on traineeships to non-participating countries.
Higher education institutions in all the Nordic countries offer double/multiple/joint degrees but the proportion of institutions offering these kinds of degrees varies between countries. Finland stands out with 83% of higher education institution offering these kinds of degrees while in the other Nordic countries between 38-55% of higher education institutions offer double/multiple/joint degrees. In all the Nordic countries, international students are in much higher numbers enrolled in double/multiple/joint degrees than local students. Denmark stands out a bit out with 86% of all double/multiple/joint degree students being international while in the other countries the proportion ranges from 68% to 74%.
When it comes to staff mobility, there is more difference in the proportion of higher education staff being mobile between countries. During the reference year, 2011-2012 between 1,3% and 5,4% of all staff at Nordic higher education institutions went on staff mobility. The balance between outgoing and incoming staff was, however, better than incoming and outgoing student mobility. In all the Nordic countries except Iceland, outgoing staff mobility was between 49-55% versus incoming staff. In Iceland staff mobility was on the other hand a bit more unbalanced with outgoing staff being 41% of the total outgoing and incoming staff.
All the Nordic higher education institutions have different types of international cooperation agreements. Erasmus agreements are the dominant type of agreements, ranging between 60 to 76% of all cooperation agreements in each country. The number of Erasmus agreements, however, varies greatly between institutions, ranging from 91 on average in Norway to 223 in Finland. Iceland has the highest proportion of other agreements than Erasmus agreements with participating countries. There 31% of agreements fall into this category. Norwegian and Swedish institutions on the other hand have the highest proportion of agreements with non-participating countries or 23% each.
When it comes to support to mobility at institutional level the data varies greatly between institutions and countries. Analysis shows that possibly the question was misunderstood or interpreted in different ways between institutions, reporting on number on people involved in administration of international affairs (heads) rather than counting only “full-time equivalent” staff. This said, the data shows that while there are 1131 students in Sweden per each supporting staff at a higher education institution there are only 600 per staff in Iceland.
In conclusion, the data analysed gives a valuable comparative view of the commonalities and differences between the Nordic countries when it comes to international cooperation activities. The analysis of statistical data is supplemented with a more qualitative view of different aspects of international cooperation activities in separate chapters of this ECHE application analysis
[1] Free movers are people who apply to a Swedish higher education program on their own and not through exchange programmes at other universities.


